How we plan, run, and record experiments: a transfection example
In a busy lab, transfection experiments can be difficult to keep on top of. Here are a few familiar reasons why:
- They can run over many days and have lots of moving parts
- It’s difficult to keep track of the details of each protocol while it’s in progress
- It’s difficult to remember the relationship between, and intent behind, the work we did previously—especially if it was a few months ago
- It can be time-consuming to align data for analysis
In the past, we might have kept on top of all these moving parts with a mixture of automation tools, notebooks (some electronic, some manual), LIMS, and ad hoc spreadsheets. Today, we can keep it all together in a single place thanks to some of the changes we’ve recently made to the Synthace platform. What does this look like?
Understanding experimental intent (without the uncertainty)
Looking back at the protocols we ran in the past can be frustrating. We might wonder: “Why did past me do X and Y like this?” Later, it turns out there was an excellent reason why we did it that way. The stakes can still be higher: when we make protocols that need sign-off before we can get to work, it pays to be sure about why we’re doing something in a certain way.
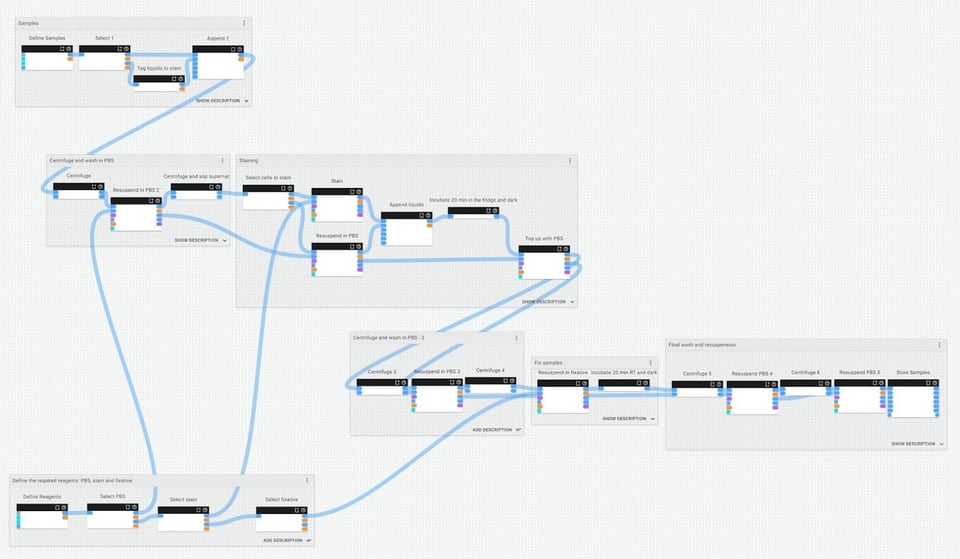
We’ve introduced Groups and Annotations to make this easier. With any Synthace workflow, we can now group elements to flesh them out with valuable context. This may save a lot of headaches later down the line and make it easier to hand things over to colleagues, if and when we need to.
While designing the staining and fixation protocol that we need as part of our transfection experiment, we’ve grouped and named its different stages, then given these groups their own descriptions to help us understand and remember the experimental context at that point:
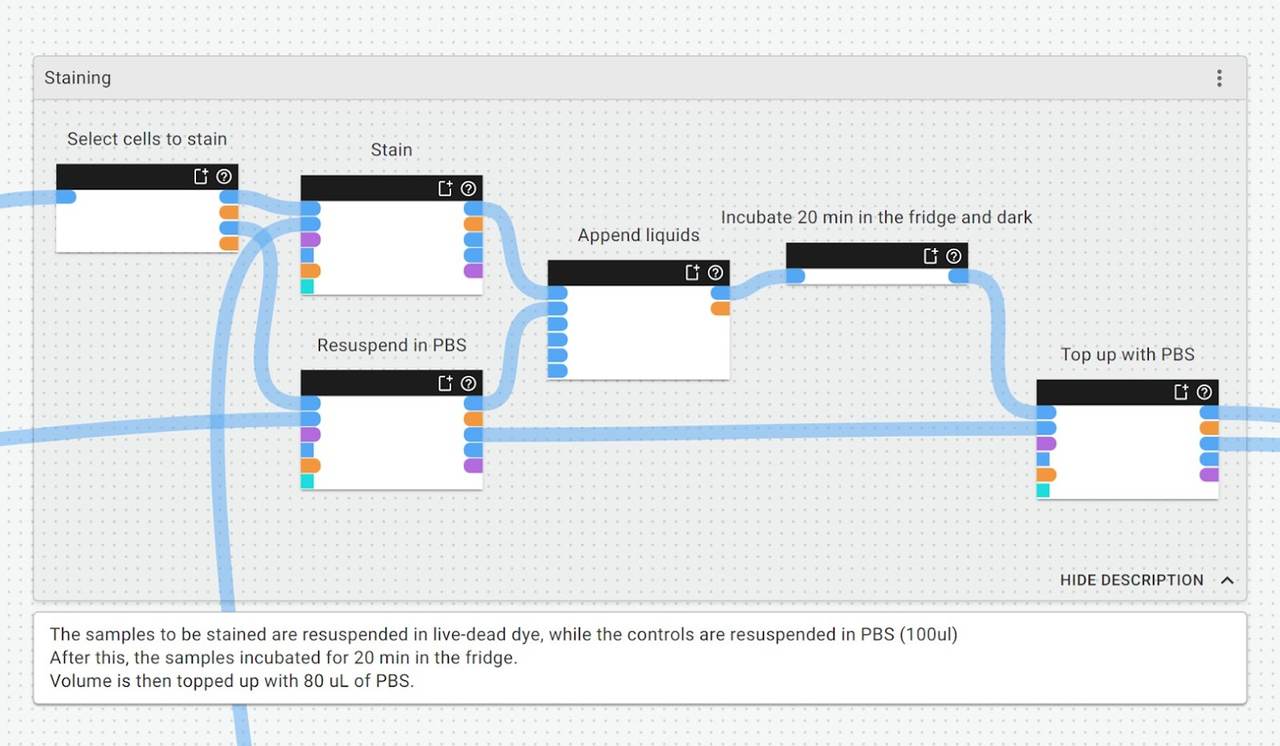
If we zoom in closer to the staining group of this protocol, we can make and review annotations about what is happening and why, and provide any other contextual notes for future users (which could be us… or somebody else):
What this means:
- You can now make implicit assumptions explicit, like why you’ve chosen to use certain volumes, concentrations, or reagents
- You can make it easier for others to understand if they’re picking up from where you left off
- You also improve the chances of successful protocol transfer and experiment reproducibility
Automatically calculating and generating manual instructions
Our transfection experiment calls for a blend of manual and automated protocols; it would be too much to do it all manually, and overkill to do everything with automation. When we’re done, it can be hard to merge and align the data from these automated and manual sources. What’s more, we don’t usually have anywhere that we can even record the manual steps that we perform.
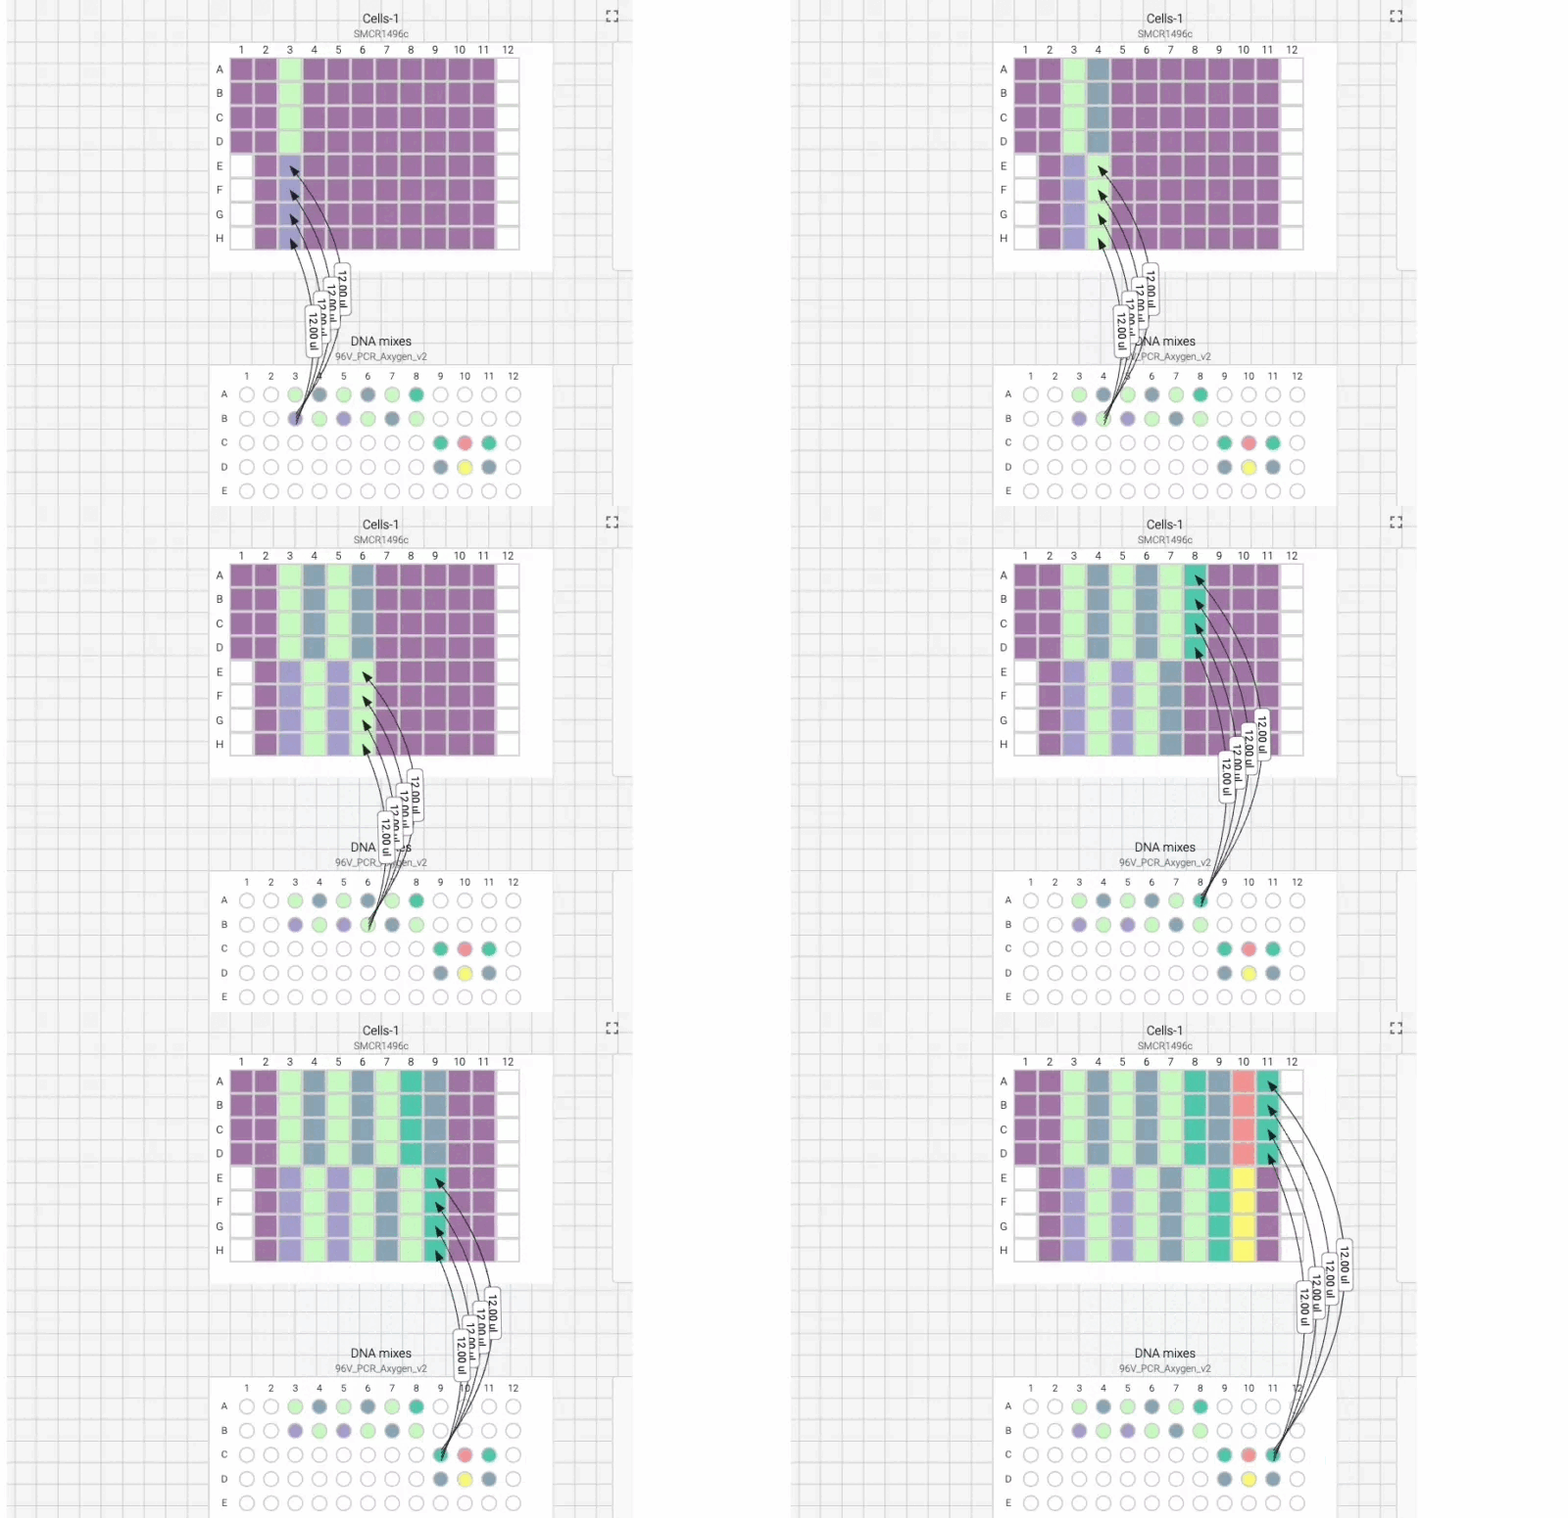
We’ve introduced Manual Execution Mode to make it easier to perform manual experiments in the lab without the added stress of calculations or planning, and to make it possible to merge data from both manual and automated protocols. As part of our broader experiment, we’re running a manual transfection protocol.
Here’s what the visual instructions look like for our manual transfection protocol, which we can tab through, step by step, using the right arrow on our keyboard:
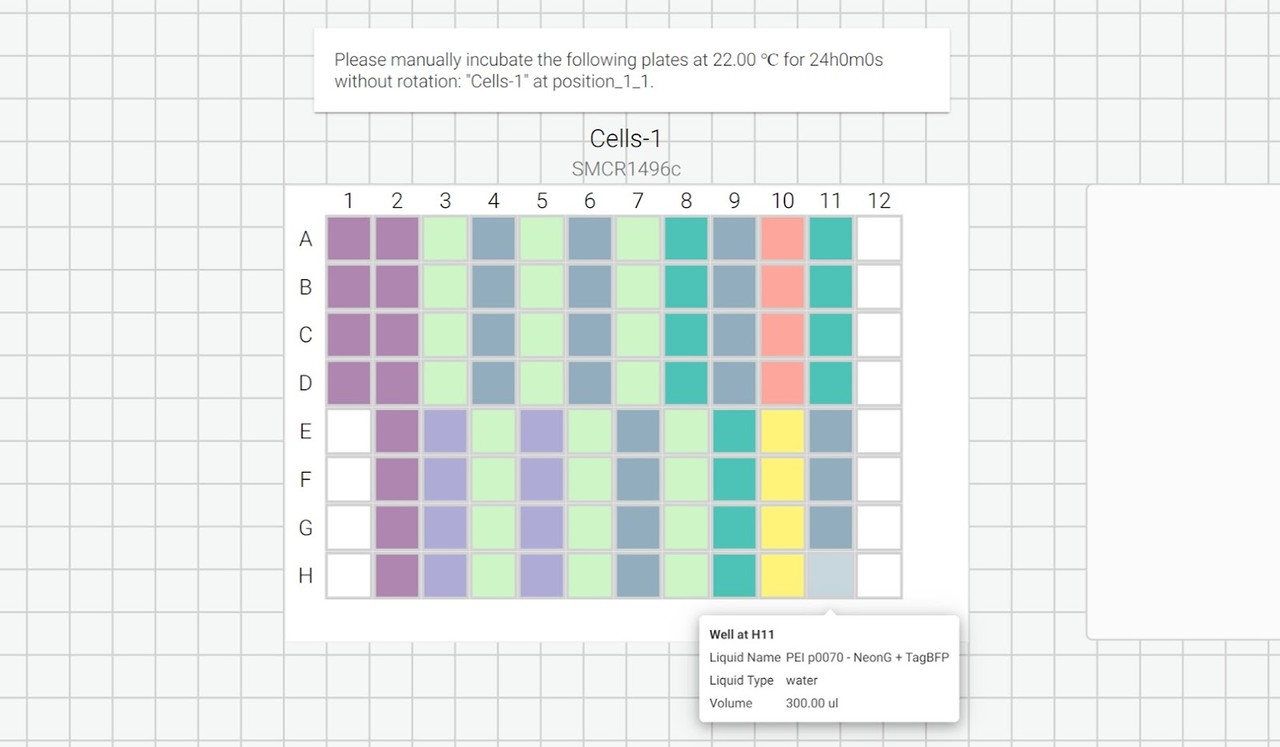
We can also include user prompts so there’s never any ambiguity about what to do next, and why. Here’s an example of the incubation prompt that we set to appear at the end of this process:
We can also export a list of instructions as a .txt file so that we can follow along, step by step:
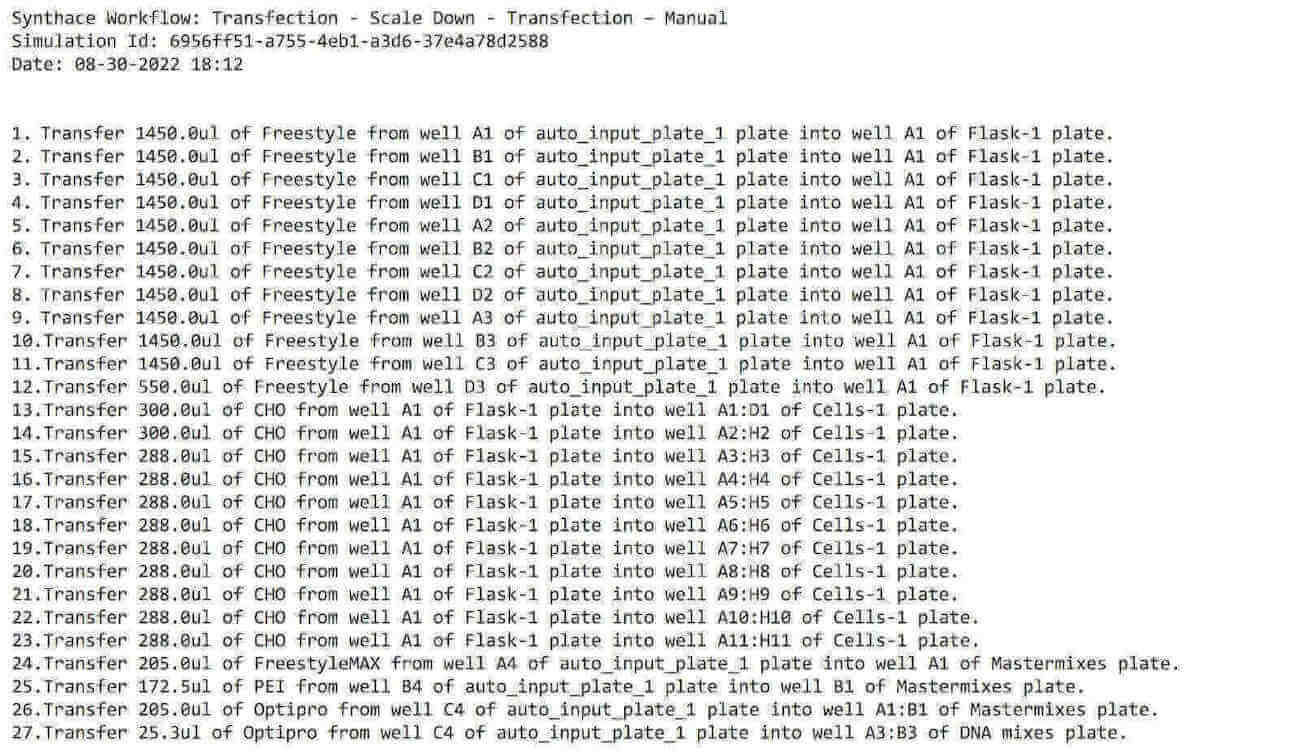
What this means:
- You don’t need to calculate or plan pipetting volumes—it’s all done automatically for you, then stored as metadata in the platform
- You can follow a step-by-step manual liquid handling plan while you’re pipetting
- You can run protocols that include a mix of manual and automated steps
- You can convert manual steps to automation steps later on, whenever you’re ready
Seeing the broader context, then aligning experimental data
Aligning data from different assays that relate to the same samples is difficult, error-prone, and time-consuming—especially when data comes from multiple different sources or manual and automated protocols. This is made worse because of how difficult it is to see the bigger picture of the entire experiment.
We’ve introduced the Experiment Map and Data Structuring to help make this easier. In a single place, the entire experimental context is visible: we can view every protocol, simulation, execution, and data set in a single place. By selecting different data sources, we can bring them together into a unified data set.
This is what our overall Experiment Map for the entire transfection experiment looks like:
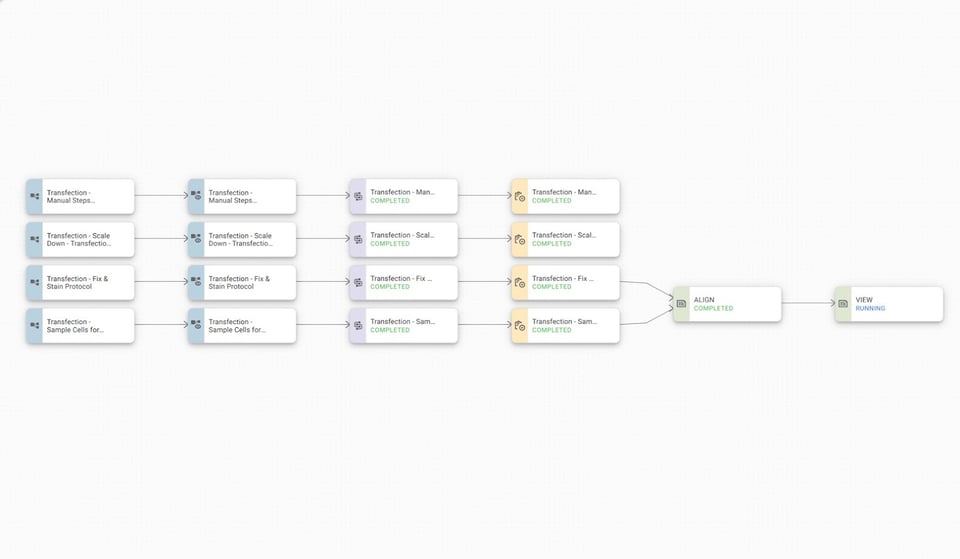
With our data aligned (in green on the right), we can then move through to reviewing the data for our cell counter and flow cytometry results:
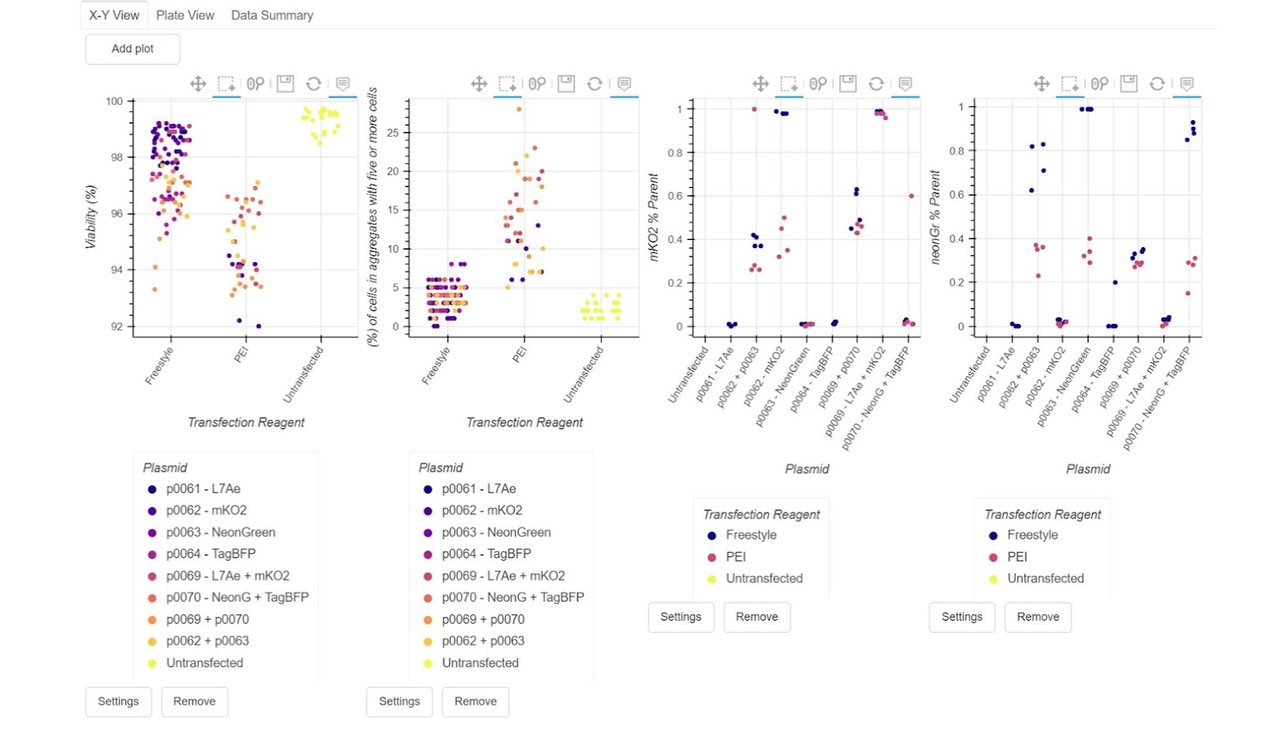
What this means:
- You can see, at a glance, how entire experiments fit and flow together
- You can align data from multiple sources within the same view
- You can visualize and download data from one or more parallel executions as part of a larger experiment
Could this help you in your lab?
We’ve already rolled this feature out to our current customers. If you think you might want to join them, or maybe just take a closer look at what the platform can do, book a call with one of our experts—they’ll be happy to help answer your questions.
This post is part of a bigger series about our latest features. Want to read more? Links are below:
Four more ways Synthace makes your experiments more likely to succeed
Manual pipetting just got a lot easier
Nuno Leitão, PhD
Dr. Nuno Leitão is a Principal Research Scientist at Synthace, where he leverages his 10 years of research experience in molecular biology, genetics, biochemistry, and DOE, to help drive product development. In his 5 years at the company, he has led and consulted on many internal projects and customer initiatives.
Other posts you might be interested in
View All PostsMeet Professor Chris Molloy, CEO at Medicines Discovery Catapult

Meet Thierry Dorval, Head of Data Science and Management at Servier

Meet Dan Thomas, CEO & Founding Consultant at Twenty24 Consulting

